One-Dimensional Bézier Graph With OpenGL
Good day! I have returned today with a pretty brief, slightly different version of the previous tutorial. It’s the latest installment in my zillion-part series on 2D game development with OpenGL. Here are all the other tutorials I’ve written so far:
- Just Draw A Stupid Triangle With OpenGL
- Making A Dopey Circle Thing With OpenGL
- Just Interpolate Already With OpenGL
- Make A Stinking Sprite With OpenGL
- Distorting Sprites’ UV Mappings With OpenGL
- Silly Spiky Stars And Donuts With OpenGL
- Rounding All The Corners With OpenGL
- Dirt Basic Animation With OpenGL
- Windows 95 Tiling Wallpaper With OpenGL
- Spiffy UV Parallax Effect With OpenGL
- More Efficient Spiffy UV Parallax Effect With OpenGL
- Wiggly Bézier Curves With OpenGL
You should try them out! In order to get the code I’ll show you in this tutorial to run, you’ll need a project folder set up like I have it in the first tutorial. Once you’ve read the earlier tutorials, this one will make a lot more sense.
Another Dimension
So I was thinking about the Wiggly Bézier curve tutorial that I wrote last time. I think I did a decent job of illustrating how you can simply integrate Bézier curves into your game. I discussed the different orders of Bézier curve–quadratic, cubic, quartic, and so on–and I even managed to pick an irrelevant fight with academic mathematicians. That was all fun, but I forgot to mention one important point. When plotting a Bézier curve, the curve’s order isn’t the only decision you have to make. You also have to decide how many dimensions you’re going to determine using the Bézier formula.
No, I’m not talking about science fiction. In the previous tutorial, we chose to determine our curve’s coordinates in two dimensions. The same is true for most Bézier curves in image editing software. But two-dimensional curves aren’t the only kind. If we wanted to, we could plot a three-dimensional curve simply by running each point’s z coordinate through the same set of calculations that we applied to the other two. In fact, if we had location information for our startDot, controlDot, and endDot in a fourth dimension, we could use it to plot a four-dimensional curve.
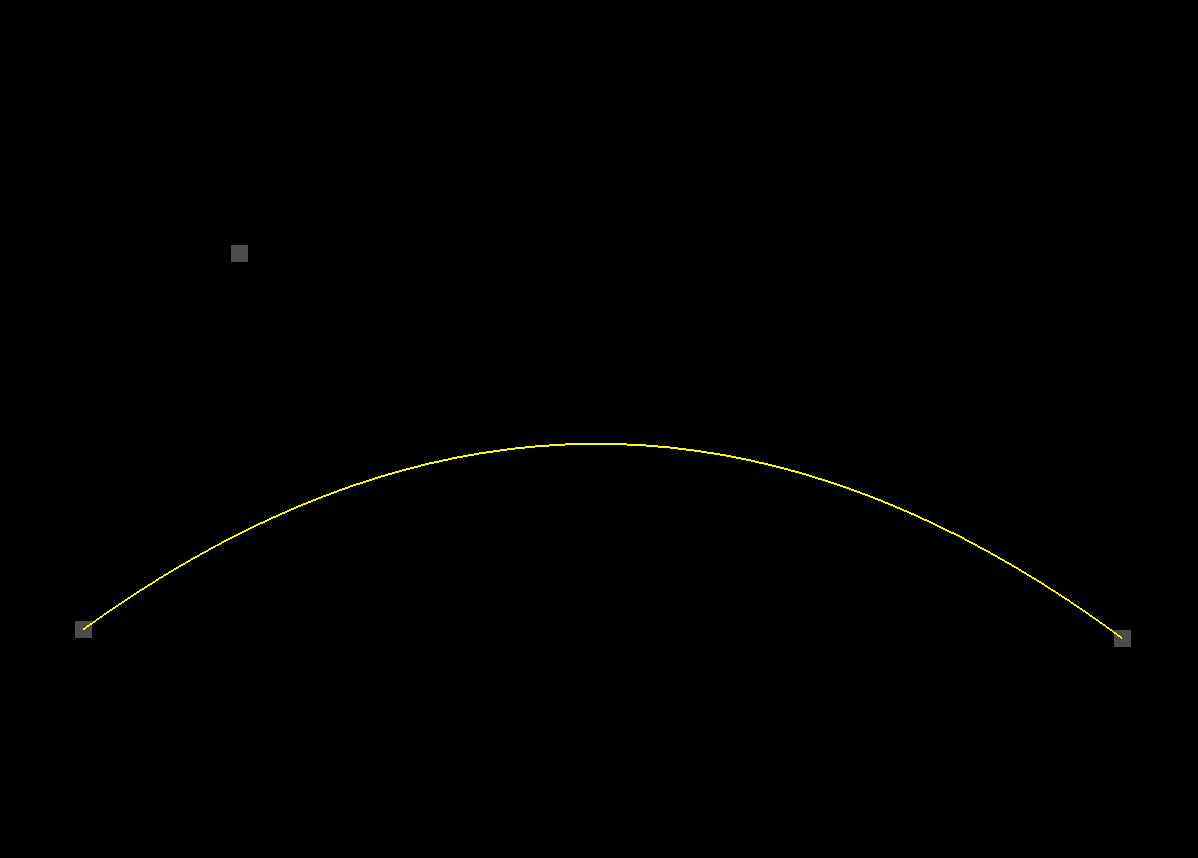
Sorry about the confusing title of this tutorial. As you know, a one-dimensional figure is simply a straight line. The animation we’ll be creating isn’t really one-dimensional. It’s two-dimensional, just like the last example. But the difference today (aside from the color of the curve) is that this curve is applying the Bézier formula to only one of its two dimensions. The other dimension will just increase linearly. What does all that mean? Basically, it’s a lot like we’re plotting a y = f(x) graph in math class. The x coordinate represents the input–our t value. And the y coordinate is simply the output of our Bézier function. Here’s what it’ll look like.
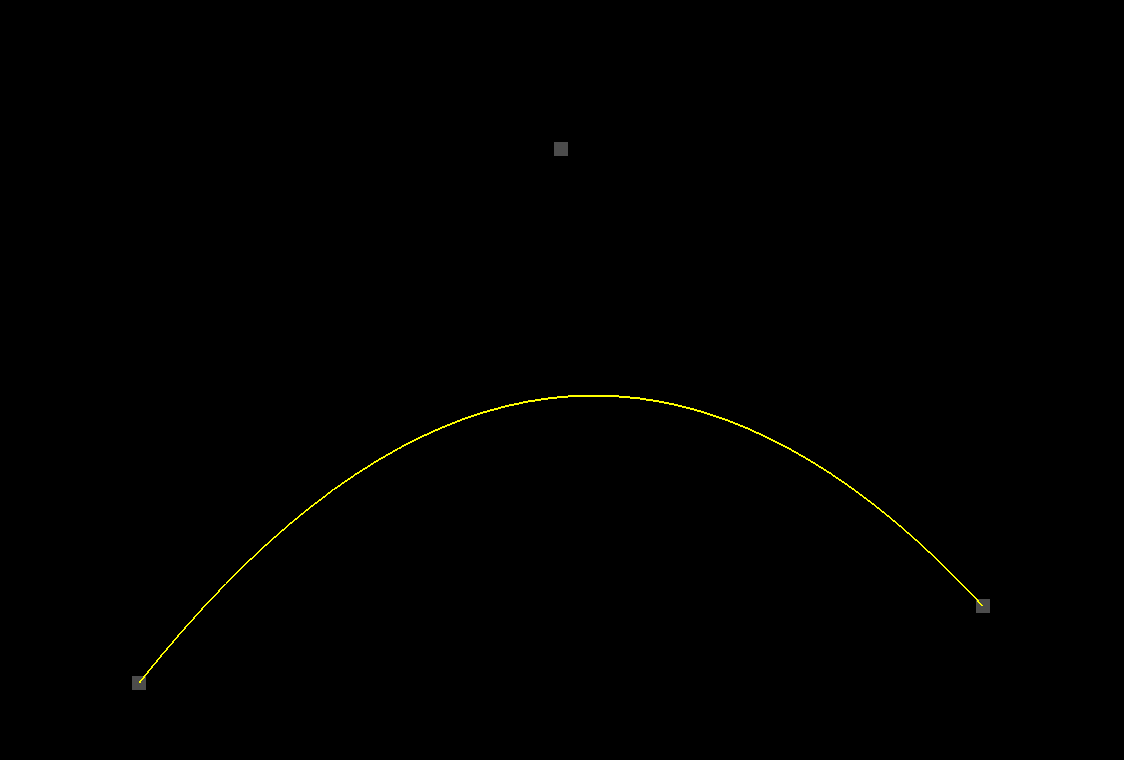
So pretty similar to last time. Except yellow. But if you watch the animation closely, you’ll notice a few other differences.
The Code Section
Here, here. Code! Copy and paste into one_dimensional_bezier.html.
<!DOCTYPE html>
<html lang="en">
  <head>
    <title>One-Dimensional Bézier Graph With OpenGL</title>
    <meta charset="utf-8">
    <meta name="viewport" content="width=device-width, user-scalable=no, minimum-scale=1.0, maximum-scale=1.0">
    <style>
      body {
        color: #ffffff;
        background-color: #000000;
        margin: 0px;
        overflow: hidden;
      }
    </style>
  </head>
  <body>

    <div id="container"></div>

    <script src="js/three.js"></script>
    <script src="js/Detector.js"></script>

    <script>

      var webGlSupported = Detector.webgl;
      if (!webGlSupported) {
        Detector.addGetWebGLMessage();
      }

      const YELLOW = new THREE.Color(1.0, 1.0, 0.0);
      const GRAY = new THREE.Color(0.3, 0.3, 0.3);

      const CURVE_POINTS_COUNT = 40;

      const CURVE_WIDTH = 300.0;

      var container = undefined;
      var camera = undefined;
      var scene = undefined;
      var renderer = undefined;

      var clock = undefined;
      var curve = undefined;

      var startDot = undefined;
      var controlDot = undefined;
      var endDot = undefined;
      var dots = undefined;

      initializeCamera();
      initializeScene();
      initializeRenderer();

      initializeClock();
      onTick();

      function initializeScene() {
        scene = new THREE.Scene();

        startDot = addDot(-CURVE_WIDTH * 0.5, 0.0, 120.0, 0.37);
        controlDot = addDot(0.0, 0.0, -90.0, 0.49);
        endDot = addDot(CURVE_WIDTH * 0.5, 0.0, 80.0, 0.41);
        dots = [startDot, controlDot, endDot];

        curve = new THREE.Line(
          getCurveGeometry(),
          getCurveMaterial()
        );
        curve.position.set(0.0, 0.0, 0.0);
        scene.add(curve);
      }

      function getCurveGeometry() {
        var geometry = new THREE.BufferGeometry();

        var vector3Size = 3;
        var positionsArraySize = CURVE_POINTS_COUNT * vector3Size;

        var positionsTypedArray = new Float32Array(positionsArraySize);

        var positionAttribute = new THREE.BufferAttribute(positionsTypedArray, vector3Size);
        geometry.addAttribute("position", positionAttribute);

        return geometry;
      }

      function getCurveMaterial() {
        return new THREE.LineBasicMaterial({
          color: YELLOW
        });
      }

      function getDotGeometry() {
        var width = 5.0;
        var height = 5.0;
        return new THREE.PlaneBufferGeometry(width, height);
      }

      function getDotMaterial() {
        return new THREE.MeshBasicMaterial({
          color: GRAY,
          side: THREE.DoubleSide
        });
      }

      function addDot(centerX, centerY, amplitude, frequency) {
        var geometry = getDotGeometry();
        var material = getDotMaterial();
        var dot = new THREE.Mesh(geometry, material);
        dot.position.setX(centerX);
        scene.add(dot);

        dot.centerY = centerY;
        dot.amplitude = amplitude;
        dot.frequency = frequency;

        return dot;
      }

      function initializeCamera() {
        var aspectRatio = window.innerWidth / window.innerHeight;
        var screenWidth = undefined;
        var screenHeight = undefined;
        if (aspectRatio > 1.0) {
          screenWidth = 320.0 * aspectRatio;
          screenHeight = 320.0;
        } else {
          screenWidth = 320.0;
          screenHeight = 320.0 / aspectRatio;
        }

        var nearPlane = 1.0;
        var farPlane = 1000.0;
        camera = new THREE.OrthographicCamera(
          -0.5 * screenWidth,
          0.5 * screenWidth,
          0.5 * screenHeight,
          -0.5 * screenHeight,

          nearPlane,
          farPlane
        );

        var distanceFromScene = 500.0;
        camera.position.set(0.0, 0.0, distanceFromScene);
      }

      function initializeRenderer() {
        renderer = new THREE.WebGLRenderer();
        renderer.setPixelRatio(window.devicePixelRatio);
        renderer.setSize(window.innerWidth, window.innerHeight);

        container = document.getElementById("container");
        container.appendChild(renderer.domElement);
      }

      function renderScene() {
        renderer.render(scene, camera);
      }

      function initializeClock() {
        clock = new THREE.Clock();
      }

      // 2
      function getQuadraticBezierHeight(startHeight, controlHeight, endHeight, t) {
        var u = (1.0 - t);

        var tSquared = t * t;
        var uSquared = u * u;
        var twoUT = 2.0 * u * t;

        return uSquared * startHeight + twoUT * controlHeight + tSquared * endHeight;
      }

      // 1
      function updateCurvePoints() {
        var positionAttribute = curve.geometry.getAttribute("position");

        for (var pointIndex = 0; pointIndex < CURVE_POINTS_COUNT; pointIndex++) {
          var t = pointIndex / (CURVE_POINTS_COUNT - 1);

          var x = t * CURVE_WIDTH - CURVE_WIDTH * 0.5;

          var y = getQuadraticBezierHeight(
            startDot.position.y,
            controlDot.position.y,
            endDot.position.y,
            t
          );

          positionAttribute.setX(pointIndex, x);
          positionAttribute.setY(pointIndex, y);
        }

        positionAttribute.needsUpdate = true;
      }

      function updateDotLocations() {
        var elapsedTime = clock.getElapsedTime();

        for (var dotIndex = 0; dotIndex < dots.length; dotIndex++) {
          var dot = dots[dotIndex];

          dot.position.setY(
            dot.centerY +
            Math.sin(dot.frequency * 2.0 * Math.PI * elapsedTime) *
            dot.amplitude
          );
        }
      }

      function onTick() {
        updateDotLocations();

        updateCurvePoints();

        renderScene();
        window.requestAnimationFrame(onTick);
      }

    </script>

  </body>
</html>
Fewer Calories
Awesome. This program is almost the same as the one from the last tutorial. I won’t bother talking about most of it. Let’s just focus on what’s new. Part // 1.
// 1
function updateCurvePoints() {
  var positionAttribute = curve.geometry.getAttribute("position");

  for (var pointIndex = 0; pointIndex < CURVE_POINTS_COUNT; pointIndex++) {
    var t = pointIndex / (CURVE_POINTS_COUNT - 1);

    var x = t * CURVE_WIDTH - CURVE_WIDTH * 0.5;

    var y = getQuadraticBezierHeight(
      startDot.position.y,
      controlDot.position.y,
      endDot.position.y,
      t
    );

    positionAttribute.setX(pointIndex, x);
    positionAttribute.setY(pointIndex, y);
  }

  positionAttribute.needsUpdate = true;
}
Even this part is pretty familiar. Can you spot the difference? Instead of calling getQuadraticBezierPoint, we’re calling getQuadraticBezierHeight. And for our x coordinate, we’re just expanding our t value (which ranges from 0.0 to 1.0) across the entire CURVE_WIDTH (which happens to be 300.0 units). So we’re just using a “height” value for our y coordinate. What does that actually mean?
What That Actually Means
To find out, scroll up slightly to part // 2.
// 2
function getQuadraticBezierHeight(startHeight, controlHeight, endHeight, t) {
  var u = (1.0 - t);

  var tSquared = t * t;
  var uSquared = u * u;
  var twoUT = 2.0 * u * t;

  return uSquared * startHeight + twoUT * controlHeight + tSquared * endHeight;
}
Ha. It’s almost exactly the same as getQuadraticBezierPoint from last time. But instead of returning a point, we’re just passing back a single number value–a height value.
Honey Bunches Of Points
If you look super, super closely at the locations of the points from the previous tutorial, you’ll notice that they’re not evenly spread out along the curve. Here’s a screenshot (from that tutorial) where I’ve added little red dots under the curve, so you can observe more easily where each of the points falls.
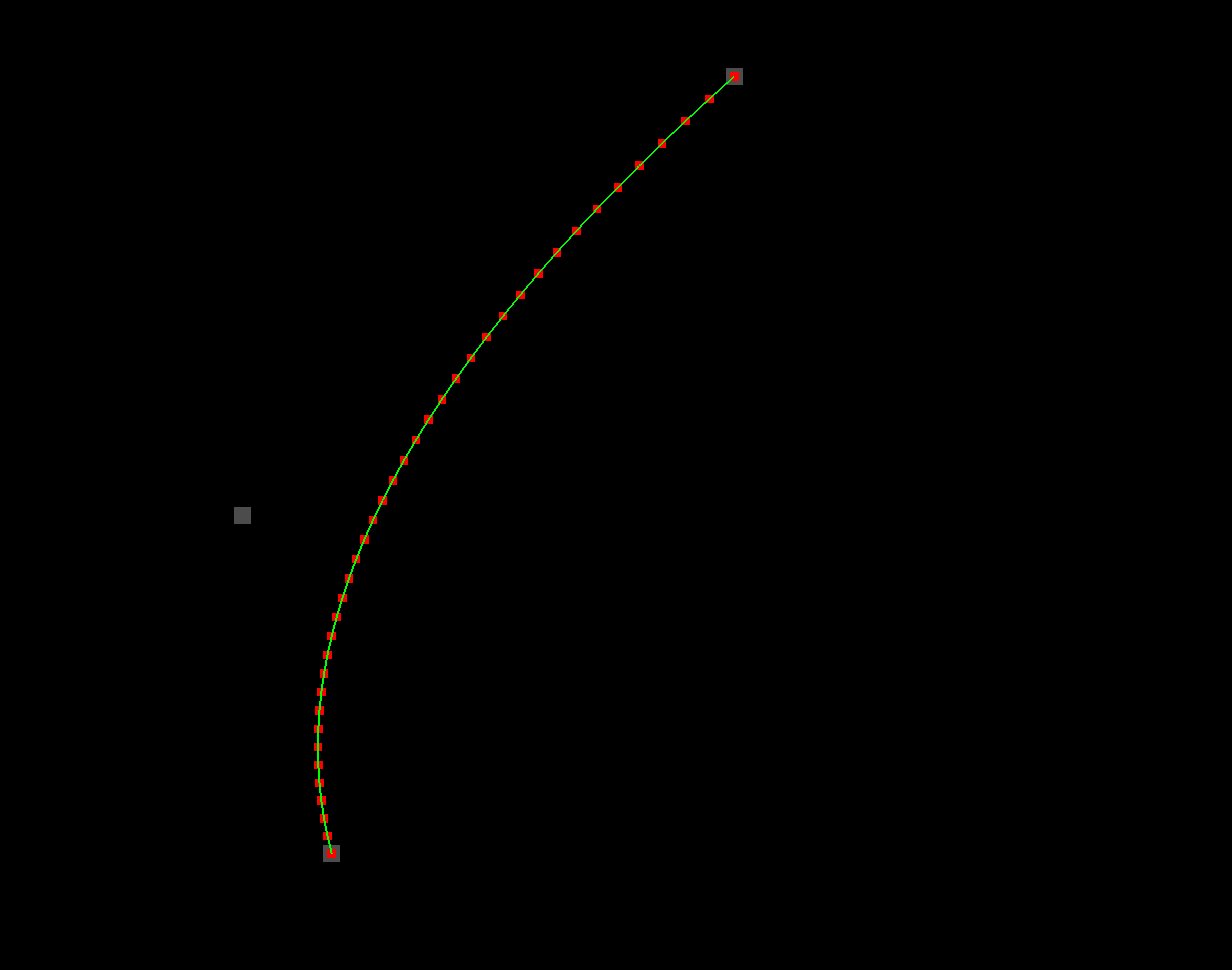
As you can see, they’re kind of bunched up. They’re a lot closer together near one of the endpoints than they are near the other. And in higher-order Bézier curves (like cubic curves), this effect becomes even more pronounced. The bunching is something you sometimes have to go out of your way to counteract. For example, if you use the raw output of a Bézier curve function to animate a sprite along a path, the sprite’s rate of travel won’t be constant. There are ways to get it to be constant, but they require some extra math that we’re not going to concern ourselves with today. 🙃
How’s The Bunching On The Yellow Curve?
You’re probably wondering how the bunching effect looks on our new, one-dimensional yellow graph.
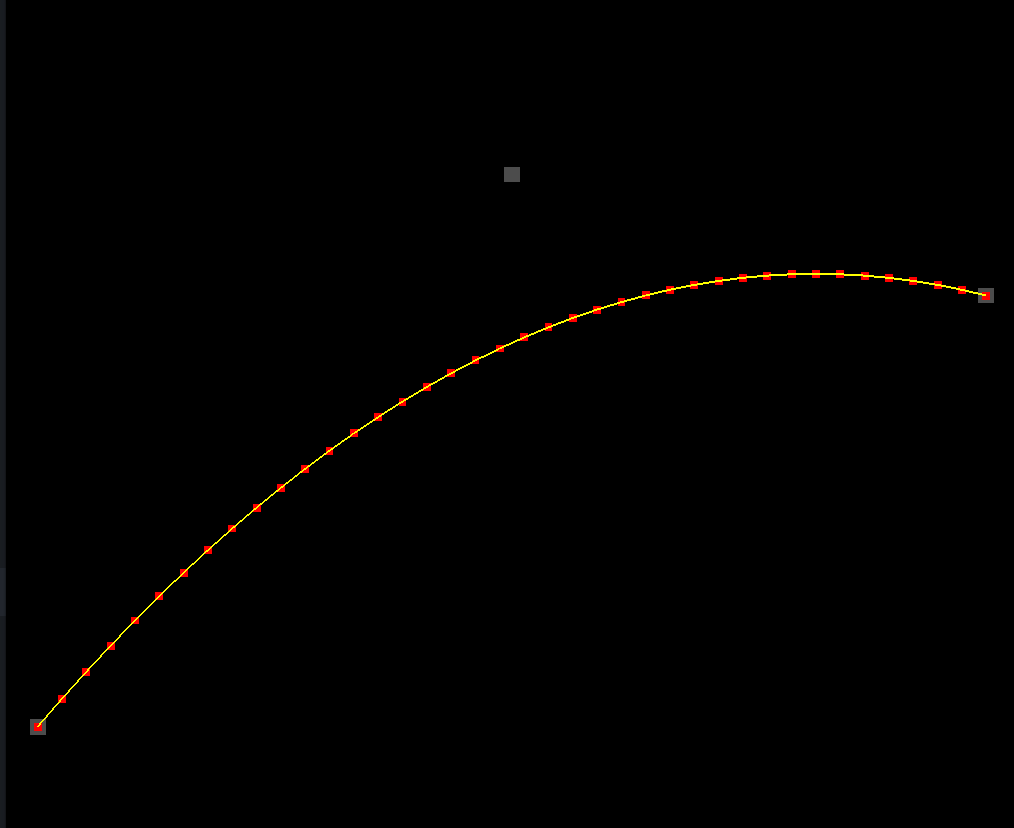
Aha–interesting. There’s definitely some bunching going on, but there’s something different about it. It turns out the bunching is only happening on the y axis. The dots are all exactly the same horizontal distance apart. There’s an optical illusion going on that might make this hard to see, but you’ll have to trust me on this one. Or if you don’t trust me, at least look at the code to verify it. 😜
var x = t * CURVE_WIDTH - CURVE_WIDTH * 0.5;
The lack of bunching along the x axis of the one-dimensional Bézier graph means that this kind of plotting is ideal for certain applications. For example, they make great eases for animations. Still–it’s important to remember that one-dimensional graphs are more confined in terms of the kinds of shapes you can create with them. If you want a nice rolling hillside, one dimension will work great. But if you need a shape that can curve back around along both axes, then you’ll need to work with two-dimensional curves.
Stay Centered
Another thing to note about the one-dimensional graph is that the controlDot is positioned at 0.0 (at the center) along the x axis. Just for fun, try setting its x coordinate to a different value. The results may surprise you.
Even though the controlDot is off center, the curve’s shape doesn’t seem to be affected at all. No matter where you move the controlDot horizontally, the curve seems to look the same. What’s up with that?
If you’ll take a look at the place where we call getQuadraticBezierHeight, you’ll notice that we’re not even passing in the dots’ position objects as we did in the previous tutorial. This time around, we’re only passing in their y coordinates.
var y = getQuadraticBezierHeight(
  startDot.position.y,
  controlDot.position.y,
  endDot.position.y,
  t
);
That means the dots’ x coordinates don’t even factor into the calculations of the curve’s shape. Since the one-dimensional plot bases x coordinates directly on the t value, the curve must always have its inflection point exactly halfway between the two endpoints. Sometimes that’s what you want, and sometimes it’s not. But it’s good to know.
That Is All
That’s all the rambling I had planned for today. But I hope you found some of it useful! You have lots of options when you’re deciding which kind of curve to use. Second-order or third? One dimension or two? And we haven’t even gotten into the other varieties of splines out there. Stay tuned for more examples. No doubt Bézier curves will be a recurring theme.
Les Downloadables
Click here to run the finished product!
And here’s a link to a downloadable version of the source code: one_dimensional_bezier.html. Note that you’ll need to run it from inside the folder structure that we set up in the first tutorial.