Wiggly Bézier Curves With OpenGL
Hi. Another day, another tutorial on 2D game development with OpenGL. Today we’re going to talk about Bézier curves, and I’m going to show you why you don’t need to be afraid of them. They’re super easy to toss into your games, and they keep graphics and animations feeling organic. Here’s a picture of the simple demo we’ll be throwing together today.
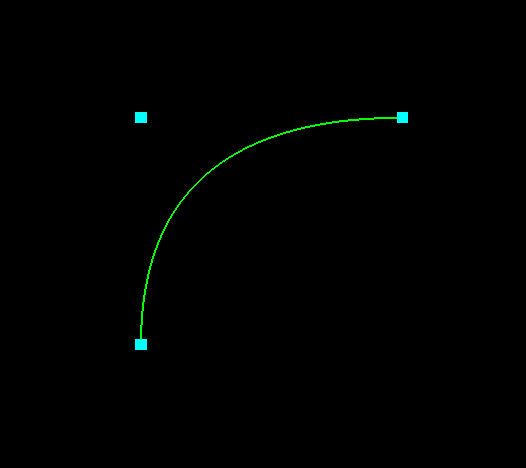
We’ll even be animating this guy so that he wiggles around and stuff. Should be pretty entertaining.
But first, you’re probably going to want to go back and read some of my other tutorials if you haven’t done that yet. Of course you’ll need your project folder set up like we did in the first tutorial. But we’re also going to be using concepts like animation and the BufferGeometry that we introduced more recently. Here’s the current list of all the tutorials.
- Just Draw A Stupid Triangle With OpenGL
- Making A Dopey Circle Thing With OpenGL
- Just Interpolate Already With OpenGL
- Make A Stinking Sprite With OpenGL
- Distorting Sprites’ UV Mappings With OpenGL
- Silly Spiky Stars And Donuts With OpenGL
- Rounding All The Corners With OpenGL
- Dirt Basic Animation With OpenGL
- Windows 95 Tiling Wallpaper With OpenGL
- Spiffy UV Parallax Effect With OpenGL
- More Efficient Spiffy UV Parallax Effect With OpenGL
Oh, By The Way
This tutorial, like all of my tutorials, is intended to teach you about OpenGL and about computer graphics in general. Although I’m using the three.js library, I’m hoping to keep the concepts I discuss as library-agnostic as possible. That means that you probably shouldn’t treat my tutorials as exemplary guides to three.js programming. If you’re seeking a beginner’s guide to three.js, there are much better resources out there on the web. In fact, if you’re planning to use three.js for Bézier curves in your own projects, then I recommend you avoid doing things the way I’m about to demonstrate.
Today we’ll be writing a version of the Bézier curve formula and using it to plot our own points. This should be a good exercise to help you understand the fundamentals of Bézier curves, but it’s actually reinventing the wheel. Three.js provides a perfectly good Bézier curve implementation that’s tested and supported by an active community. I promise it’s more robust than my demo code. 😉
A Brief History Of Bézier
I’m not going to spend too much time telling you what a Bézier curve is or how they came about. If you’ve ever used any computer graphics program ever, you’ll surely recognize them.
They’re ubiquitous in computer graphics today because they’re so versatile and yet so simple. They’re named after some French guy, although really he was only one of several other humans responsible for introducing them. Originally they were used for things like modeling car parts, but why should car companies have all the fun? You can do much cooler stuff with them in games.
Much Cooler Stuff
Let’s try to figure out how they work. Make another file in your opengl_examples folder called wiggly_bezier.html. Here’s the code to copy in.
<!DOCTYPE html>
<html lang="en">
  <head>
    <title>Wiggly Bézier Curves With OpenGL</title>
    <meta charset="utf-8">
    <meta name="viewport" content="width=device-width, user-scalable=no, minimum-scale=1.0, maximum-scale=1.0">
    <style>
      body {
        color: #ffffff;
        background-color: #000000;
        margin: 0px;
        overflow: hidden;
      }
    </style>
  </head>
  <body>

    <div id="container"></div>

    <script src="js/three.js"></script>
    <script src="js/Detector.js"></script>

    <script>

      var webGlSupported = Detector.webgl;
      if (!webGlSupported) {
        Detector.addGetWebGLMessage();
      }

      const GREEN = new THREE.Color(0.0, 1.0, 0.0);
      const GRAY = new THREE.Color(0.3, 0.3, 0.3);

      const CURVE_POINTS_COUNT = 40;

      var container = undefined;
      var camera = undefined;
      var scene = undefined;
      var renderer = undefined;

      var clock = undefined;
      var curve = undefined;

      var startDot = undefined;
      var controlDot = undefined;
      var endDot = undefined;
      var dots = undefined;

      initializeCamera();
      initializeScene();
      initializeRenderer();

      initializeClock();
      onTick();

      // 1
      function initializeScene() {
        scene = new THREE.Scene();

        startDot = addDot(-80.0, -80.0, 40.0, -0.25 * Math.PI);
        controlDot = addDot(0.0, 0.0, 90.0, 0.75 * Math.PI);
        endDot = addDot(80.0, 80.0, 40.0, 0.5 * Math.PI);
        dots = [startDot, controlDot, endDot];

        curve = new THREE.Line(
          getCurveGeometry(),
          getCurveMaterial()
        );
        curve.position.set(0.0, 0.0, 0.0);
        scene.add(curve);
      }

      function getCurveGeometry() {
        var geometry = new THREE.BufferGeometry();

        var vector3Size = 3;
        var positionsArraySize = CURVE_POINTS_COUNT * vector3Size;

        var positionsTypedArray = new Float32Array(positionsArraySize);

        var positionAttribute = new THREE.BufferAttribute(positionsTypedArray, vector3Size);
        geometry.addAttribute("position", positionAttribute);

        return geometry;
      }

      function getCurveMaterial() {
        return new THREE.LineBasicMaterial({
          color: GREEN
        });
      }

      function getDotGeometry() {
        var width = 5.0;
        var height = 5.0;
        return new THREE.PlaneBufferGeometry(width, height);
      }

      function getDotMaterial() {
        return new THREE.MeshBasicMaterial({
          color: GRAY,
          side: THREE.DoubleSide
        });
      }

      function addDot(centerX, centerY, radius, radiansPerSecond) {
        var geometry = getDotGeometry();
        var material = getDotMaterial();
        var dot = new THREE.Mesh(geometry, material);
        scene.add(dot);

        dot.centerX = centerX;
        dot.centerY = centerY;
        dot.radius = radius;
        dot.radiansPerSecond = radiansPerSecond;

        return dot;
      }

      function initializeCamera() {
        var aspectRatio = window.innerWidth / window.innerHeight;
        var screenWidth = undefined;
        var screenHeight = undefined;
        if (aspectRatio > 1.0) {
          screenWidth = 320.0 * aspectRatio;
          screenHeight = 320.0;
        } else {
          screenWidth = 320.0;
          screenHeight = 320.0 / aspectRatio;
        }

        var nearPlane = 1.0;
        var farPlane = 1000.0;
        camera = new THREE.OrthographicCamera(
          -0.5 * screenWidth,
          0.5 * screenWidth,
          0.5 * screenHeight,
          -0.5 * screenHeight,

          nearPlane,
          farPlane
        );

        var distanceFromScene = 500.0;
        camera.position.set(0.0, 0.0, distanceFromScene);
      }

      function initializeRenderer() {
        renderer = new THREE.WebGLRenderer();
        renderer.setPixelRatio(window.devicePixelRatio);
        renderer.setSize(window.innerWidth, window.innerHeight);

        container = document.getElementById("container");
        container.appendChild(renderer.domElement);
      }

      function renderScene() {
        renderer.render(scene, camera);
      }

      function initializeClock() {
        clock = new THREE.Clock();
      }

      // 4
      function getQuadraticBezierPoint(startPoint, controlPoint, endPoint, t) {
        var u = (1.0 - t);

        var tSquared = t * t;
        var uSquared = u * u;
        var twoUT = 2.0 * u * t;

        var x = uSquared * startPoint.x + twoUT * controlPoint.x + tSquared * endPoint.x;
        var y = uSquared * startPoint.y + twoUT * controlPoint.y + tSquared * endPoint.y;

        return new THREE.Vector3(x, y, 0.0);
      }

      // 3
      function updateCurvePoints() {

        var positionAttribute = curve.geometry.getAttribute("position");

        for (var pointIndex = 0; pointIndex < CURVE_POINTS_COUNT; pointIndex++) {
          var t = pointIndex / (CURVE_POINTS_COUNT - 1);

          var curvePoint = getQuadraticBezierPoint(
            startDot.position,
            controlDot.position,
            endDot.position,
            t
          );

          positionAttribute.setX(pointIndex, curvePoint.x);
          positionAttribute.setY(pointIndex, curvePoint.y);
        }

        positionAttribute.needsUpdate = true;
      }

      function updateDotLocations() {
        var elapsedTime = clock.getElapsedTime();

        for (var dotIndex = 0; dotIndex < dots.length; dotIndex++) {
          var dot = dots[dotIndex];

          var angle = elapsedTime * dot.radiansPerSecond;

          dot.position.setX(dot.centerX + Math.cos(angle) * dot.radius);
          dot.position.setY(dot.centerY + Math.sin(angle) * dot.radius);
        }
      }

      // 2
      function onTick() {
        updateDotLocations();

        updateCurvePoints();

        renderScene();
        window.requestAnimationFrame(onTick);
      }

    </script>

  </body>
</html>
There are two major new things that are going on in this code. One of them is the three gray dots and their motions. I’m not going to cover them so much, since they’re pretty similar to meshes and animations we’ve done before. There’s nothing particularly interesting about the way they move–it’s just a wobbly pattern I whipped up that looks sort of cool if you draw a curve through it.
Draw A Curve Through It
So let’s talk about the more interesting part: the curve itself. Take a look at part // 1.
// 1
function initializeScene() {
  scene = new THREE.Scene();

  startDot = addDot(-80.0, -80.0, 40.0, -0.25 * Math.PI);
  controlDot = addDot(0.0, 0.0, 90.0, 0.75 * Math.PI);
  endDot = addDot(80.0, 80.0, 40.0, 0.5 * Math.PI);
  dots = [startDot, controlDot, endDot];

  curve = new THREE.Line(
    getCurveGeometry(),
    getCurveMaterial()
  );
  curve.position.set(0.0, 0.0, 0.0);
  scene.add(curve);
}
So you’ve got your scene. You’re adding those dots to it, which I said I wasn’t going to explain so much. And then you’re adding this new, weird three.js class that we haven’t seen before. What’s a THREE.Line? Don’t get too caught up here–it basically works the same way as a THREE.Mesh. The only difference is that it works with OpenGL to draw lines instead of triangles. Since OpenGL’s lines have a lot of limitations, I try to avoid resorting to them in actual game code. But they’re handy for quick examples like this one. I won’t spend time going into the details of line drawing in three.js, but if you glance at getCurveGeometry below, you’ll see that it’s just another BufferGeometry like the one we used in the previous tutorial. Nothing to see here.
Every Frame
I marked part // 2 to help you follow the order of events that occur in each frame of our animation.
// 2
function onTick() {
  updateDotLocations();

  updateCurvePoints();

  renderScene();
  window.requestAnimationFrame(onTick);
}
It’s pretty simple. Each frame, we update our dots’ locations according to my weird wobbly formula. And then we use the dots’ new locations to update the points in our curve object. Note that we’re not changing the curve’s location or rotation at all–we’re just reassigning the locations of all of the points it contains. And that’s actually all there is to our animation.
Every Point
So how do we update the curve’s points? For that, let’s move up to part // 3.
// 3
function updateCurvePoints() {

  var positionAttribute = curve.geometry.getAttribute("position");

  for (var pointIndex = 0; pointIndex < CURVE_POINTS_COUNT; pointIndex++) {
    var t = pointIndex / (CURVE_POINTS_COUNT - 1);

    var curvePoint = getQuadraticBezierPoint(
      startDot.position,
      controlDot.position,
      endDot.position,
      t
    );

    positionAttribute.setX(pointIndex, curvePoint.x);
    positionAttribute.setY(pointIndex, curvePoint.y);
  }

  positionAttribute.needsUpdate = true;
}
First, we’re pulling that positionAttribute out of our geometry object. It’s exactly like what we did for the uvAttribute in our uv parallax BufferGeometry example. Next, we enter our for loop. For each point, we’re calculating a mysterious t value, which we’re passing into getQuadraticBezierPoint. It hands back a Vector3 object, whose x and y values we then copy into our BufferGeometry at the corresponding pointIndex by way of the positionAttribute object. So all we’re really doing in this function is copying location information. But where does that location information come from?
Do You Really Want To Know?
Math. It comes from math. But it’s not as terrifying as it sounds. Don’t freak out or anything.
To get through this example, we’re going to need to know a little more about the mathematical basis of Bézier curves. First, it’s worth pointing out that Bézier curves (sometimes called Bézier splines) are just one of several different types of spline that are useful in graphics work. Perhaps someday I’ll do an alternate version of this tutorial using cardinal splines or something. But another important distinction is that there are actually several different kinds of Bézier curve as well.
Quadratic, Cubic, Quartic, And Other Intimidating Words
When you think of a Bézier curve, you probably think of a third-order or cubic Bézier curve. But there are also first-order curves (actually just straight lines), second-order (quadratic) curves, fourth-order (quartic) curves, and so on. Cubic Bézier curves are by far the most popular because they provide the perfect balance between control and simplicity. If you place them end-to-end, you can form just about any shape with them. So they’re everywhere–from CAD to fonts. In fact, there’s a good chance the very characters you’re reading right now were rendered from cubic curves.
Although cubic curves are more practical overall, today we’re going to stick to quadratic curves for simplicity’s sake. Once you see how quadratic curves work, making the jump to cubic is pretty simple. But I should probably warn you about something. You know how in image editing software, each Bézier curve always has two endpoints and then two control point thingies coming off of it? Well that’s because they’re cubic curves. Fourth-order curves have three control points. Third-order curves have two control points. And second-order curves (the kind we’ll be using today) have only one control point. But don’t make fun of them! They still look pretty cool in the end.
This Won’t Hurt A Bit
Take a deep breath. For part // 4 we’re going to have to look at some formulas. Here’s the definition of a quadratic Bézier curve.

Uugh. I kind of hate mathematicians because of garbage like this. I don’t know about you, but whenever I see an equation with one-letter variable names written in that stupid italicized math font, my eyes glaze over and I start muttering curses. Nobody can glance at that gibberish and figure out what it means. That’s why in computers, we’re sensible, and we give our variables descriptive names. Sorry–I might need a minute.
…
Okay, I’m calm now. Let’s take another look at that formula and see if we can’t turn it into code.
But First, More Programmer Rage
Here we go. Starting at the left side of the formula, we have Q(t) =. Q is just the name of the function in math language, and t is the argument. That [0, 1] is an annoying way of saying that t is a progress value. If t has a value of 0.0, the point we get out of the function will be the start point of the curve. Or, if t has a value of 1.0, the function will return the end point.
So now we know what Q and t represent… but we have no idea what these P0, P1, and P2 critters are all about. Of course, how would we, because once again mathematicians don’t provide any means for you to figure that out on your own. 😡 It’s like they want to obscure their knowledge so that nobody who isn’t in their special elitist club can play. Grrr. Well… it turns out those three P variables are just the three control points–the start point, the control point, and the end point, respectively. Why didn’t they just say so? They didn’t have to be so snooty about it.
Chill Out, Aaron
Perhaps I’ve been a little unfair to all the academic mathematicians out there. Sorry, folks. I recognize that mathematicians have a different way of communicating their ideas, and just because I personally find it impractical doesn’t make it any less valid. Given the number of computing pioneers who were also applied mathematicians, it’s a little hypocritical of me to disrespect mathematical tradition. Still, I think it’s fair to say that math would be more accessible if mathematicians occasionally wrote books with fewer hieroglyphs and more descriptive language. I suppose I should reserve my fury for the software developers who insist on using one-letter variables and abbreviations everywhere. As if typing out full words is such an oppressive task. But that’s a rant for another time.
Finally… let’s try this again.
Our Regularly Scheduled Programming
Here’s what I did in part // 4.
// 4
function getQuadraticBezierPoint(startPoint, controlPoint, endPoint, t) {
  var u = (1.0 - t);

  var tSquared = t * t;
  var uSquared = u * u;
  var twoUT = 2.0 * u * t;

  var x = uSquared * startPoint.x + twoUT * controlPoint.x + tSquared * endPoint.x;
  var y = uSquared * startPoint.y + twoUT * controlPoint.y + tSquared * endPoint.y;

  return new THREE.Vector3(x, y, 0.0);
}
Did you notice how I labeled everything, mathematicians?! Okay–everything except for t. I could’ve called it progress or something, but I didn’t think it would improve my readability at all. In order to understand what a quadratic Bézier point is to begin with, you already kind of have to know what a t value is and what it corresponds to. It’s a pretty universal way of representing progress in graphics and animation in general… even in code. I suppose I can live with that.
Let’s take one final look at that horrendous formula. I promise this will be the last time.
If you look closely, you’ll see how my variables are matching up with the variables in the formula. I’m translating it into JavaScript. I factored out this (1 - t) thing that gets repeated and just called it u. From there, you can see how I got tSquared (for t2), uSquared (for (1 - t)2), and twoUT (for 2 * (1 - t) * t). The lines where I calculate x and y simply substitute in those variables, along with the x and y coordinate values from the three points we passed in. In this program, those three points are the positions of our three dots.
Are you ready for some good news? Now you know how to plot a Bézier curve.

Let’s Celebrate!
Woohoo! High five. See? You made it through. You had to read some mathspeak, but I’ll bet it wasn’t as bad as you expected. Like so many other concepts in computer graphics, building Bézier curves is as simple as following a formula. It’s just a matter of knowing what to plug into it, and what to do with the output.
Now sit back and distract yourself with a dancing spline for a while. You deserve it! If you feel like it, you could try to come up with a new animation for the dots to follow. But no pressure or anything.
One quick thing you should probably try is turning the value of CURVE_POINTS_COUNT way down. With 40 points, the curve is pretty smooth. But don’t forget that this animation is merely an approximation. We’ve calculated a bunch of points along the curve, and we’re just drawing lines between them. With the CURVE_POINTS_COUNT set to about 8, the jagginess of the approximation will really start to show.
To The Downloadablesmobile
Click here to run the finished product!
And here’s a link to a downloadable version of the source code: wiggly_bezier.html. Note that you’ll need to run it from inside the folder structure that we set up in the first tutorial.